
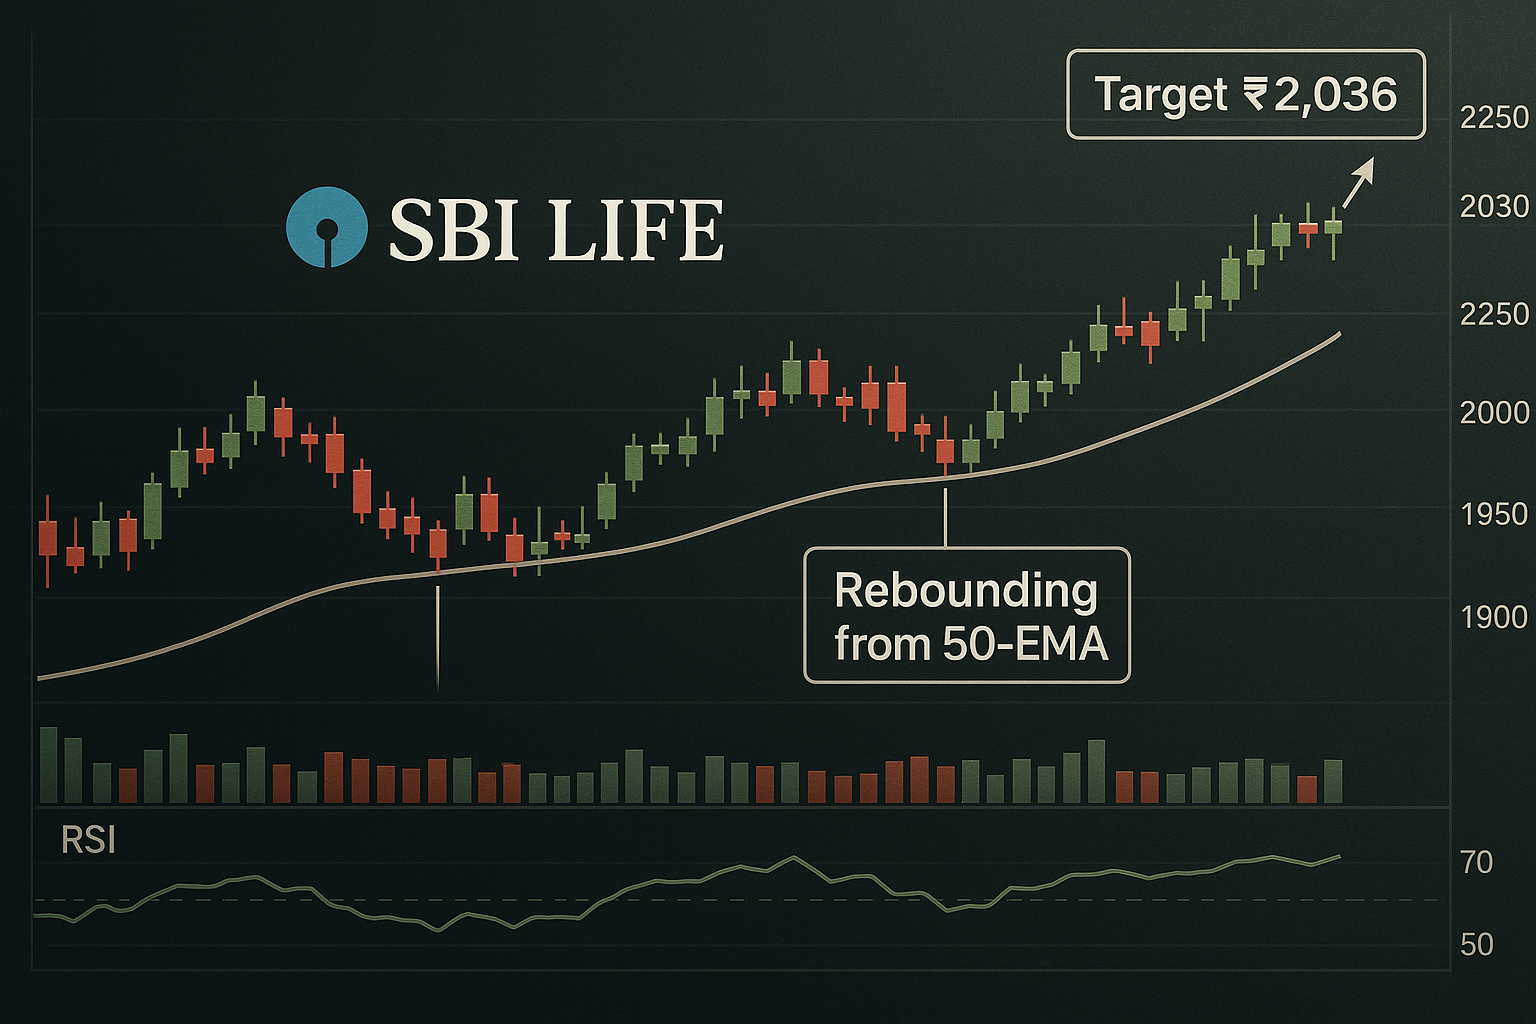
SBI Life Insurance Company Ltd (NSE: SBILIFE) is showing signs of renewed bullish momentum, rebounding sharply from its 50‑day Exponential Moving Average (DEMA) and igniting interest among technical traders. With a short-term target of ₹2,036 now on the radar, market participants are positioning for a potential breakout, supported by strong trend indicators and volume activity.
Background: Technical Rebound at Support Zone
Rebound from 50‑DEMA: The stock recently tested and respected the 50‑day DEMA near ₹1,800–₹1,820 — a key dynamic support level — triggering a technical bounce on healthy volume.
Hidden Bullish RSI Divergence: Weekly Relative Strength Index (RSI) analysis shows a hidden bullish divergence, a signal of latent strength building under the surface, often preceding sharp upward moves.
Trend Structure: SBILIFE continues to hold above all major moving averages (50‑, 100‑, and 200‑DMA), reinforcing a medium-term uptrend structure.
Target Price and Stop‑Loss Framework
| Metric | Level |
|---|---|
| Immediate Target | ₹2,036–₹2,040 |
| Support Zone | ₹1,800–₹1,820 (50‑DEMA band) |
| Stop‑Loss Level | Below ₹1,790 |
| Upside Potential | ~10–11% from current levels |
Analysts from GEPL Capital and other brokerages have pointed to ₹2,036 as a near-term target, contingent on sustained buying and no breach of the 50‑DEMA support. A prudent stop-loss below ₹1,790 helps manage downside risk.
Risk Breakdown & Market Setup
Volume Validation: The recent rebound occurred with rising volumes, confirming buying conviction.
Resistance Levels: A breakout above ₹1,875 would open up upside toward its previous swing high of ₹1,936 and eventually ₹2,036.
Caution Flags: Any breakdown below ₹1,790 with declining volume could indicate trend failure or exhaustion.
Expert View
“The stock is setting up for a measured move toward ₹2,036 after stabilizing around the 50‑DEMA. The risk-reward remains favorable as long as price holds above ₹1,800,”
— GEPL Capital Technical Research Desk
“RSI divergence and higher lows continue to show trend maturity. ₹2,000 is a psychological level, and ₹2,036 is achievable if bulls hold momentum,”
— Independent Technical Analyst View, TradingView
What Traders Should Watch
| Indicator | Implication |
|---|---|
| 50‑DEMA Rebound | Acts as confirmation of strong short-term demand |
| Weekly RSI Divergence | Signals continuation of long-term uptrend |
| Volume Confirmation | Validates accumulation and breakout potential |
| Break Above ₹1,875 | Would indicate continuation toward ₹2,036 target |
Market Implications
SBI Life’s technical setup aligns with broader bullish trends in the insurance sector, which has seen steady fund inflows amid declining bond yields and strong Q1 earnings. With a market cap of ~₹1.84 lakh crore and robust fundamentals, SBILIFE is well-positioned for further institutional accumulation.
Conclusion
SBI Life’s bounce from the 50‑DEMA has reinforced market confidence in the ongoing uptrend. A move toward ₹2,036 appears technically justified, provided the support zone of ₹1,800–₹1,820 holds firm. Short-term swing traders may consider entries with tight stop-losses, while positional traders can wait for a breakout above ₹1,875 to confirm strength.
Disclaimer: This article is intended for informational purposes only and does not constitute financial advice. Readers are advised to consult with their financial advisors before making investment decisions.